PHP profiling with blackfire
How to set up and profile php using blackfire.io
Disclaimer: Our Tech Blog is a showcase of the amazing talent and personal interests of our team. While the content is reviewed for accuracy, each article is a personal expression of their interests and reflects their unique style. Welcome to our playground!
Introduction
Profiling an application is like the first date with someone: you never know how it goes until you have your first chat. This simple operation will tell you many things in the big picture. You will understand, by this simple action, how fast is your application, how many resources it consumes, and many insights on how it communicates with third-party services.
In the php world, one profiler struck our attention: blackfire.io. It’s easy to set up, easier to use and really nice to navigate through the report.
In this post we will try to give some useful information on setting it up with docker, profile it with both browser plugin and cli, and we will give you summary information on how to read the report.
Free plan or paid plan
Free plan is unlimited in time, but very limited in functionalities. You get only the time call graph and the single request profile. It’s not much, but it’s a lot better than nothing. You can start with free plan to get accustomed to the tool, but eventually I recommend switching a paid plan to enjoy this tool in all its forms.
Setup
You can set it up to run on your machine or within docker containers. We, at Sparkfabrik, work with containers so this setup section will focus on docker and docker-compose. For setting it up directly on your machine, please refer to the official documentation.
With docker-compose
Two main components are required to profile with blackfire: the agent, and the probe. The probe will be compiled within the php container. In your php Dockerfile you need to add this:
# If you don't use Alpine as your base image, you need to set this value to "linux"
ENV current_os=alpine
RUN version=$(php -r "echo PHP_MAJOR_VERSION.PHP_MINOR_VERSION;") \
    && curl -A "Docker" -o /tmp/blackfire-probe.tar.gz -D - -L -s https://blackfire.io/api/v1/releases/probe/php/$current_os/amd64/$version \
    && mkdir -p /tmp/blackfire \
    && tar zxpf /tmp/blackfire-probe.tar.gz -C /tmp/blackfire \
    && mv /tmp/blackfire/blackfire-*.so $(php -r "echo ini_get('extension_dir');")/blackfire.so \
    && printf "extension=blackfire.so\nblackfire.agent_socket=tcp://blackfire:8307\n" > $PHP_INI_DIR/conf.d/blackfire.ini \
    && rm -rf /tmp/blackfire /tmp/blackfire-probe.tar.gz
This snippet will install the probe as php extension and will configure your php.ini file to connect to the agent with this statement:
blackfire.agent_socket=tcp://blackfire:8307
Hold on into this, we’ll get back to it soon!
To have the agent up and running, we will use the blackfire image and reference it into our docker-compose.yml file:
blackfire:
    image: blackfire/blackfire:2
    environment:
      - BLACKFIRE_SERVER_ID
      - BLACKFIRE_SERVER_TOKEN
      - BLACKFIRE_CLIENT_ID
      - BLACKFIRE_CLIENT_TOKEN
    command: sh -c "sleep 10 && blackfire agent:start --socket tcp://0.0.0.0:8307 --config /dev/null"
(With blackfire/blackfire:2 the latest v2 version is used. :latest tag is mapped on v1 agent version.)
You can notice that when the blackfire container will be bootstrapped, the command executed is to start listening for tcp incoming requests on port 8387.
The probe is configured, as stated above, to connect to blackfire host at port 8387.
So if you rename your service container, make sure the change is reflected in php.ini conf.
The blackfire env credentials can be found on your account credentials page. Now in your terminal, export those env variables:
export BLACKFIRE_SERVER_ID = 123dummytoken
export BLACKFIRE_SERVER_TOKEN = 456servertoken
When running the PHP container, you need to expose a BLACKFIRE_SERVER_ID and a BLACKFIRE_SERVER_TOKEN environment variables as well:
php:
    image: php:7.4-fpm
    environment:
      - BLACKFIRE_SERVER_ID
      - BLACKFIRE_SERVER_TOKEN
Now your env is ready; run docker-compose up -d to bootstrap your application. if all containers are up & running with docker-compose ps, then your setup is ready.
If you see the Exit status on blackfire a good tool to start debugging is docker-compose logs blackfire. Verify that the Blackfire module is installed on PHP with the following command:
php -m
Profile
Profiling is the act of running the Blackfire probe on your PHP server, and instrumenting the requests intercepted by the probe. This can be done against API calls and standard web page navigation.
Blackfire will automatically instrument your codebase, so there is no need to make changes to profile, however you can choose to manually probe pieces of code with the PHP sdk (blackfire/php-sdk),
more information can be found on the SDK on the GitHub page: https://github.com/blackfireio/php-sdk.
Blackfire paid plan also provides the periodic build feature which can be added to your pipeline with a predetermined set of actions (API calls, method execution, usual site navigation). This will automatically generate profiles and can test them against your custom assertions. Read more about this in the official documentation.
Using Browser plugin
The Blackfire extension is the easiest way to profile and gather data of a current codebase, it is available for Firefox and Chrome, and can be found in their respective plugin stores. The plugin depends on the installation of the Blackfire probe on the PHP server with the necessary credentials, and also to be logged in via the portal on https://blackfire.io.
Once setup is completed, navigate to the page you wish to analyze, active the plugin, and start the profiling session. You should see a toolbar appear at the top of your page.
The toolbar is a fast way to get basic information of a request, it shows:
- Total execution time for PHP to generate the page (Wall Time)
- I/O time
- CPU time
- Memory consumed by PHP
This baseline data should give you an indication of which requests to give the most attention to. For a deeper look into the analysis, click the View Call Graph on the toolbar view the full
profile data.
In case your website’s pages are not served by PHP e.g a single page application such as React or Angular, you may see the following error message from Blackfire:
Are You Authorized to Profile this Page? Probe Not Found or Invalid signature (404).
As the PHP server is not directly serving pages, the Blackfire probe will not intercept the requests. One solution to this is to instrument all requests made, which can be done by
opening the plugin dialog box and selecting the option Profile all requests, which will open a dialog at the bottom of the page. After profiling your page, stop the profiling with the same dialog.
Because all requests are being profiled, you will not see the basic information described above within the toolbar.
Using cli
Profiling via cli is useful when you want to automate your profiling task, or if you’re addressing a specific scenario like profiling a drush command.
The blackfire cli tool is already shipped within the blackfire image so the only thing you need are the BLACKFIRE_CLIENT_ID and the BLACKFIRE_CLIENT_TOKEN env variables set in the container.
You can profile either simple php scripts or curl requests.
To use it first get inside the blackfire container
docker-compose run --rm blackfire ash
or by creating a shell alias for a simpler to remember command:
alias blackfire=`docker-compose run --rm blackfire blackfire`
and then run the desired command:
blackfire curl http://example.com/my-custom-page
or if it’s a script:
blackfire run php my-script.php
If everything is set up correctly you will get a similar output:
blackfire curl http://example.com/my-custom-page
Profiling: [########################################] 100%
Blackfire cURL completed
Graph                 https://blackfire.io/profiles/<DUMMY-PROFILER-UUID>/graph
Timeline              https://blackfire.io/profiles/<DUMMY-PROFILER-UUID>/graph?settings%5Bdimension%5D=timeline
No tests!             Create some now https://blackfire.io/docs/testing-cookbooks/tests
5 recommendations     https://blackfire.io/profiles/<DUMMY-PROFILER-UUID>/graph?settings%5BtabPane%5D=recommendations

Wall Time    45.2ms
I/O Wait     4.35ms
CPU Time     40.9ms
Memory       8.72MB
Network         n/a     n/a     n/a
SQL           883µs     8rq
blackfire.io UI explained
After having profiled requests of your page, you can access the full results through the Blackfire dashboard, under https://blackfire.io/my/profiles, or by clicking the View Call Graph button on the toolbar of the browser.
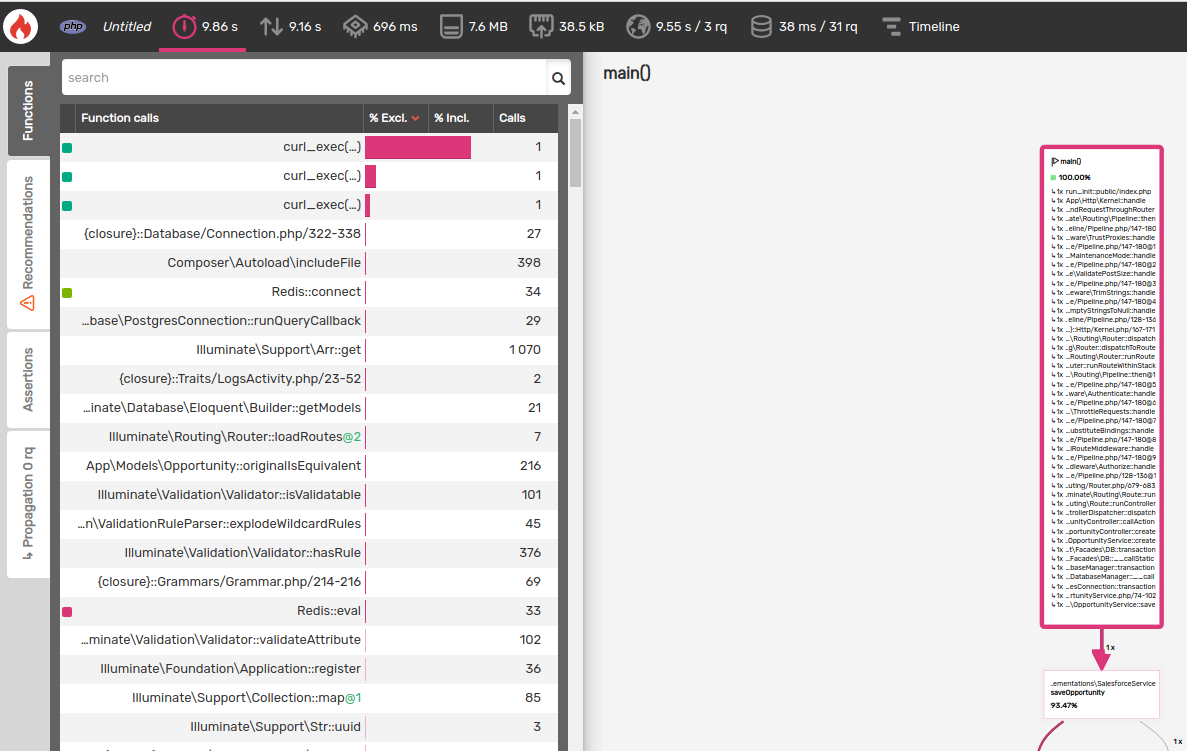
The Blackfire dashboard is made up of a flow graph (call graph) on the right, and a table of the requests on the left. Requests which took the longest execution time are shown at the top, and are those which the most attention should be given to.
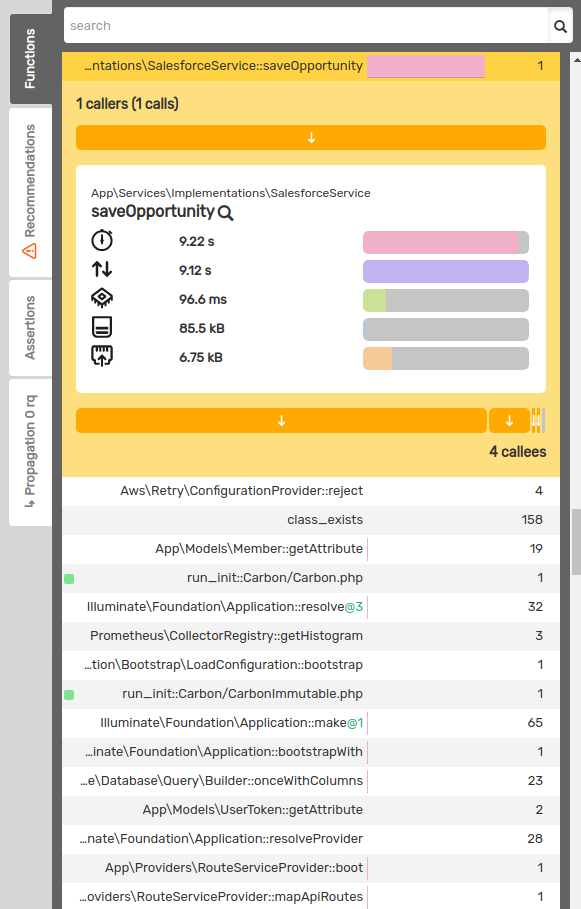
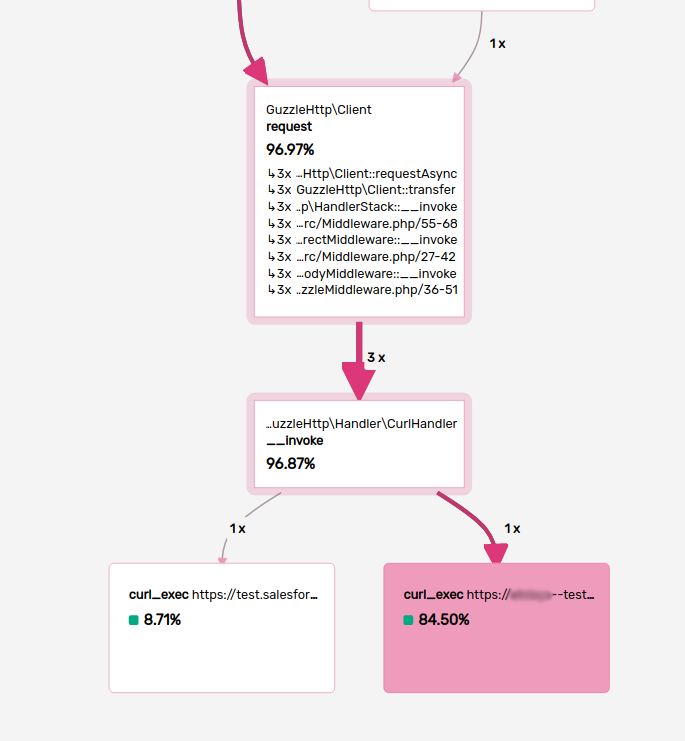
Within the graph, each box represents a function call, the numbers between the boxes indicates the amount of times this function was called, the edges show the execution flow. The percentage within the box indicates the percentage of execution time that function took, and by clicking a box, you are shown the breakdown of the call with the same information found in the browser toolbar.
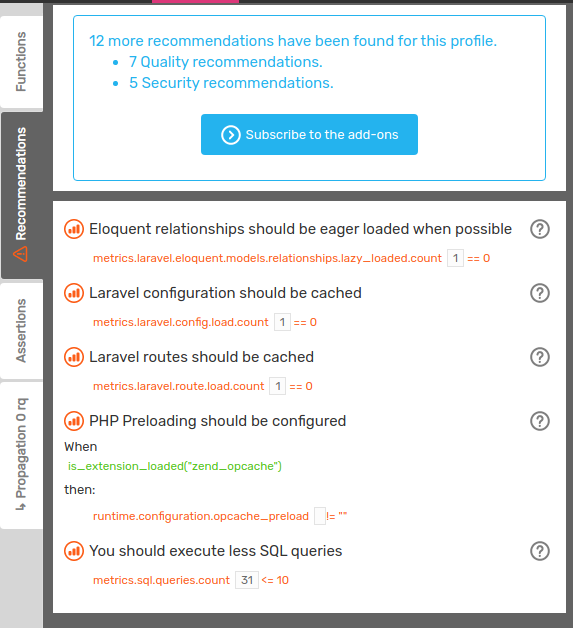
On the left side of the request contents, Blackfire provides recommendations towards optimizing your application. In this example, the advice is mostly regarding caching.
Clicking on the ? gives detailed instructions on how to implement the recommendations. For example, if the PHP server is running Laravel, Blackfire will show the commands needed to enable caching.
After making changes to your codebase it is important to check the impact on your application. Run tests, and compare profiles before and after optimization by using the Compare feature of the dashboard.
Conclusion
We’ve covered all the basics of Blackfire and how to get started profiling your application. Optimization is a huge part of web development, and can turn into a headache, it’s important to always review your codebase as development is underway. Blackfire is easy to setup, does not interfere with your code base, adds no overhead, and its intuitive dashboard provides easy analysis of your profiles. We recommended first try out the free plan and to play around with the interface, implement recommendations, and compare performance between profiles.
Useful resources
- Official training resources: https://blackfire.io/docs/php/training-resources/book/index
- Docker integration: https://blackfire.io/docs/php/integrations/php-docker
- Install on localhost: https://blackfire.io/docs/up-and-running/installation
