Tracking 4G stats from the CLI with Node.js
Because keeping a browser tab open all the time was annoying me more than it should.
Disclaimer: Our Tech Blog is a showcase of the amazing talent and personal interests of our team. While the content is reviewed for accuracy, each article is a personal expression of their interests and reflects their unique style. Welcome to our playground!
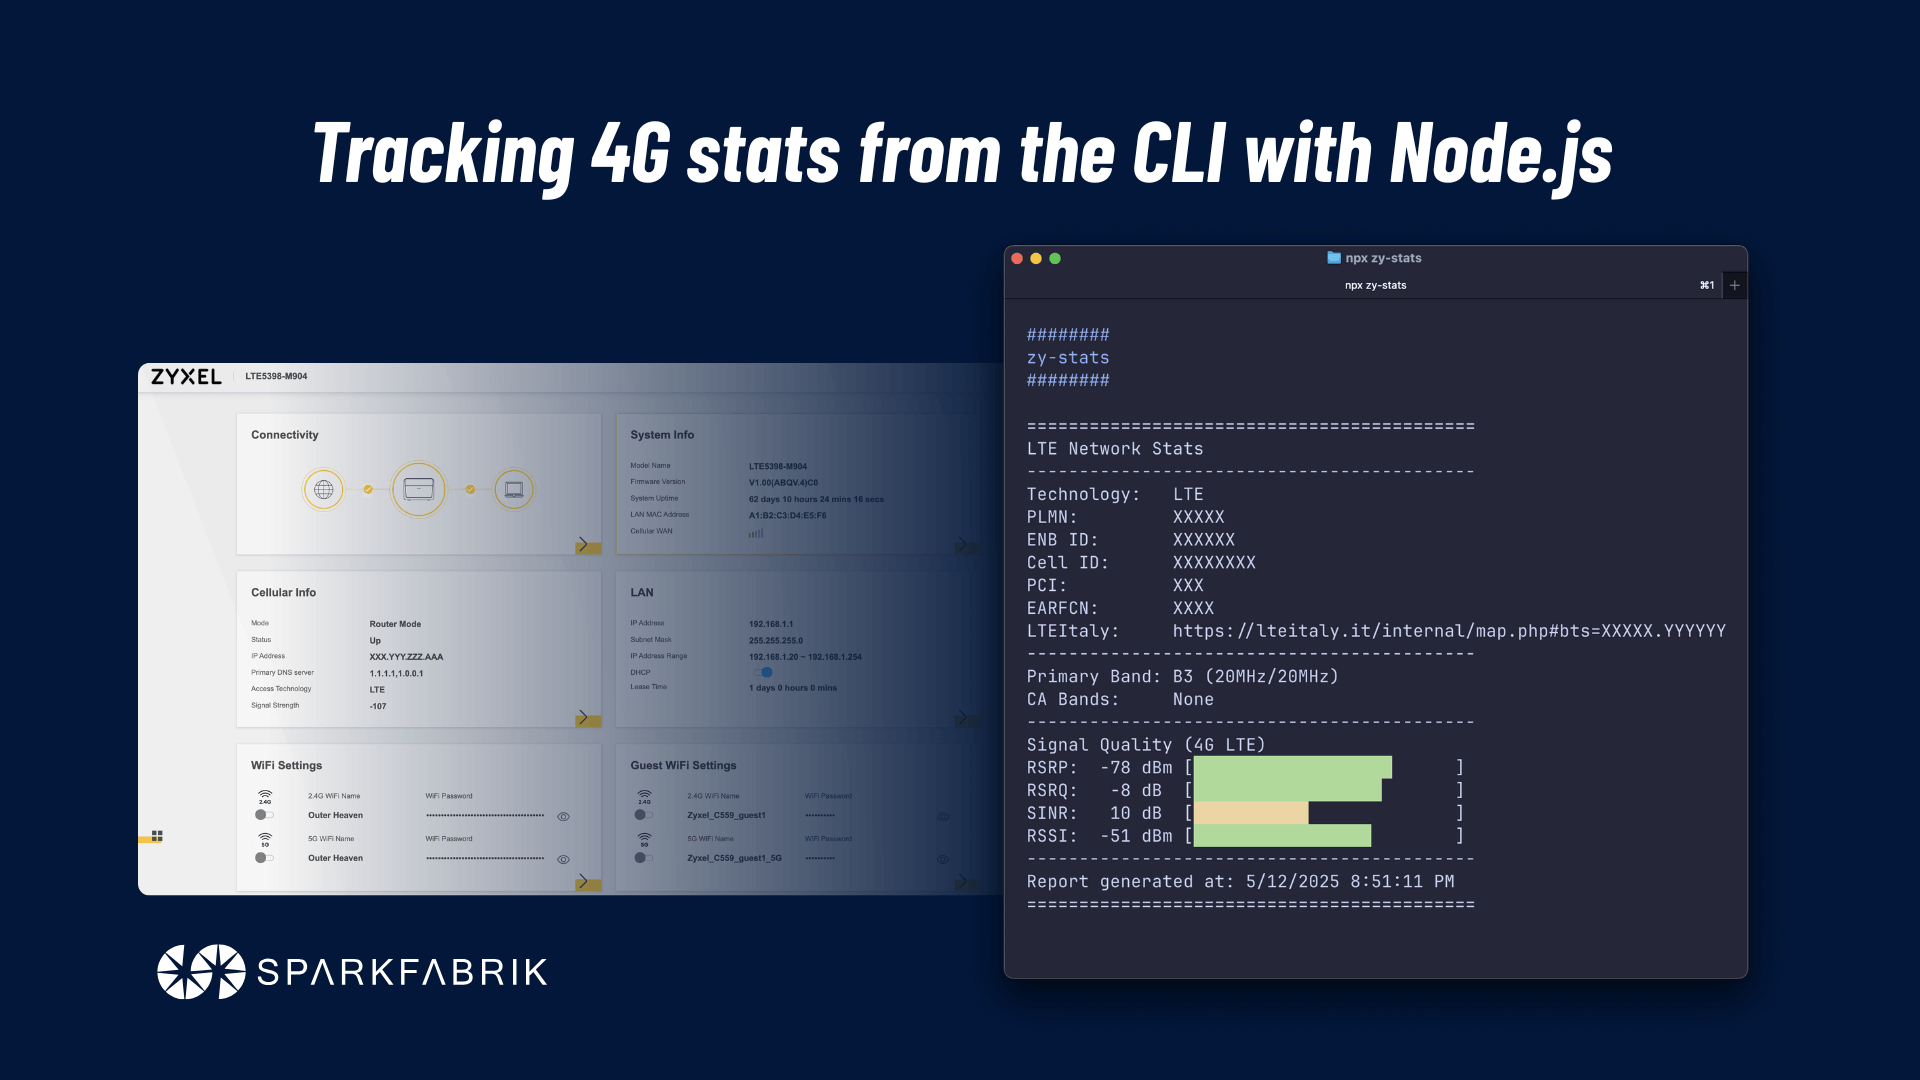
In this article, I’ll walk you through my journey developing this little CLI tool that I built to track my modem’s 4G stats. If you want to learn more about why I decided to embark on this journey, check out this other article: zy-stats. Without further ado, let’s dive into how I built it!
Preface
At home, I have the following modem providing Internet access: Zyxel LTE5398-M904. It works quite well; Zyxel is a well-established brand in the networking world. Its web interface allows you to check most of the connection stats. The homepage looks like this:
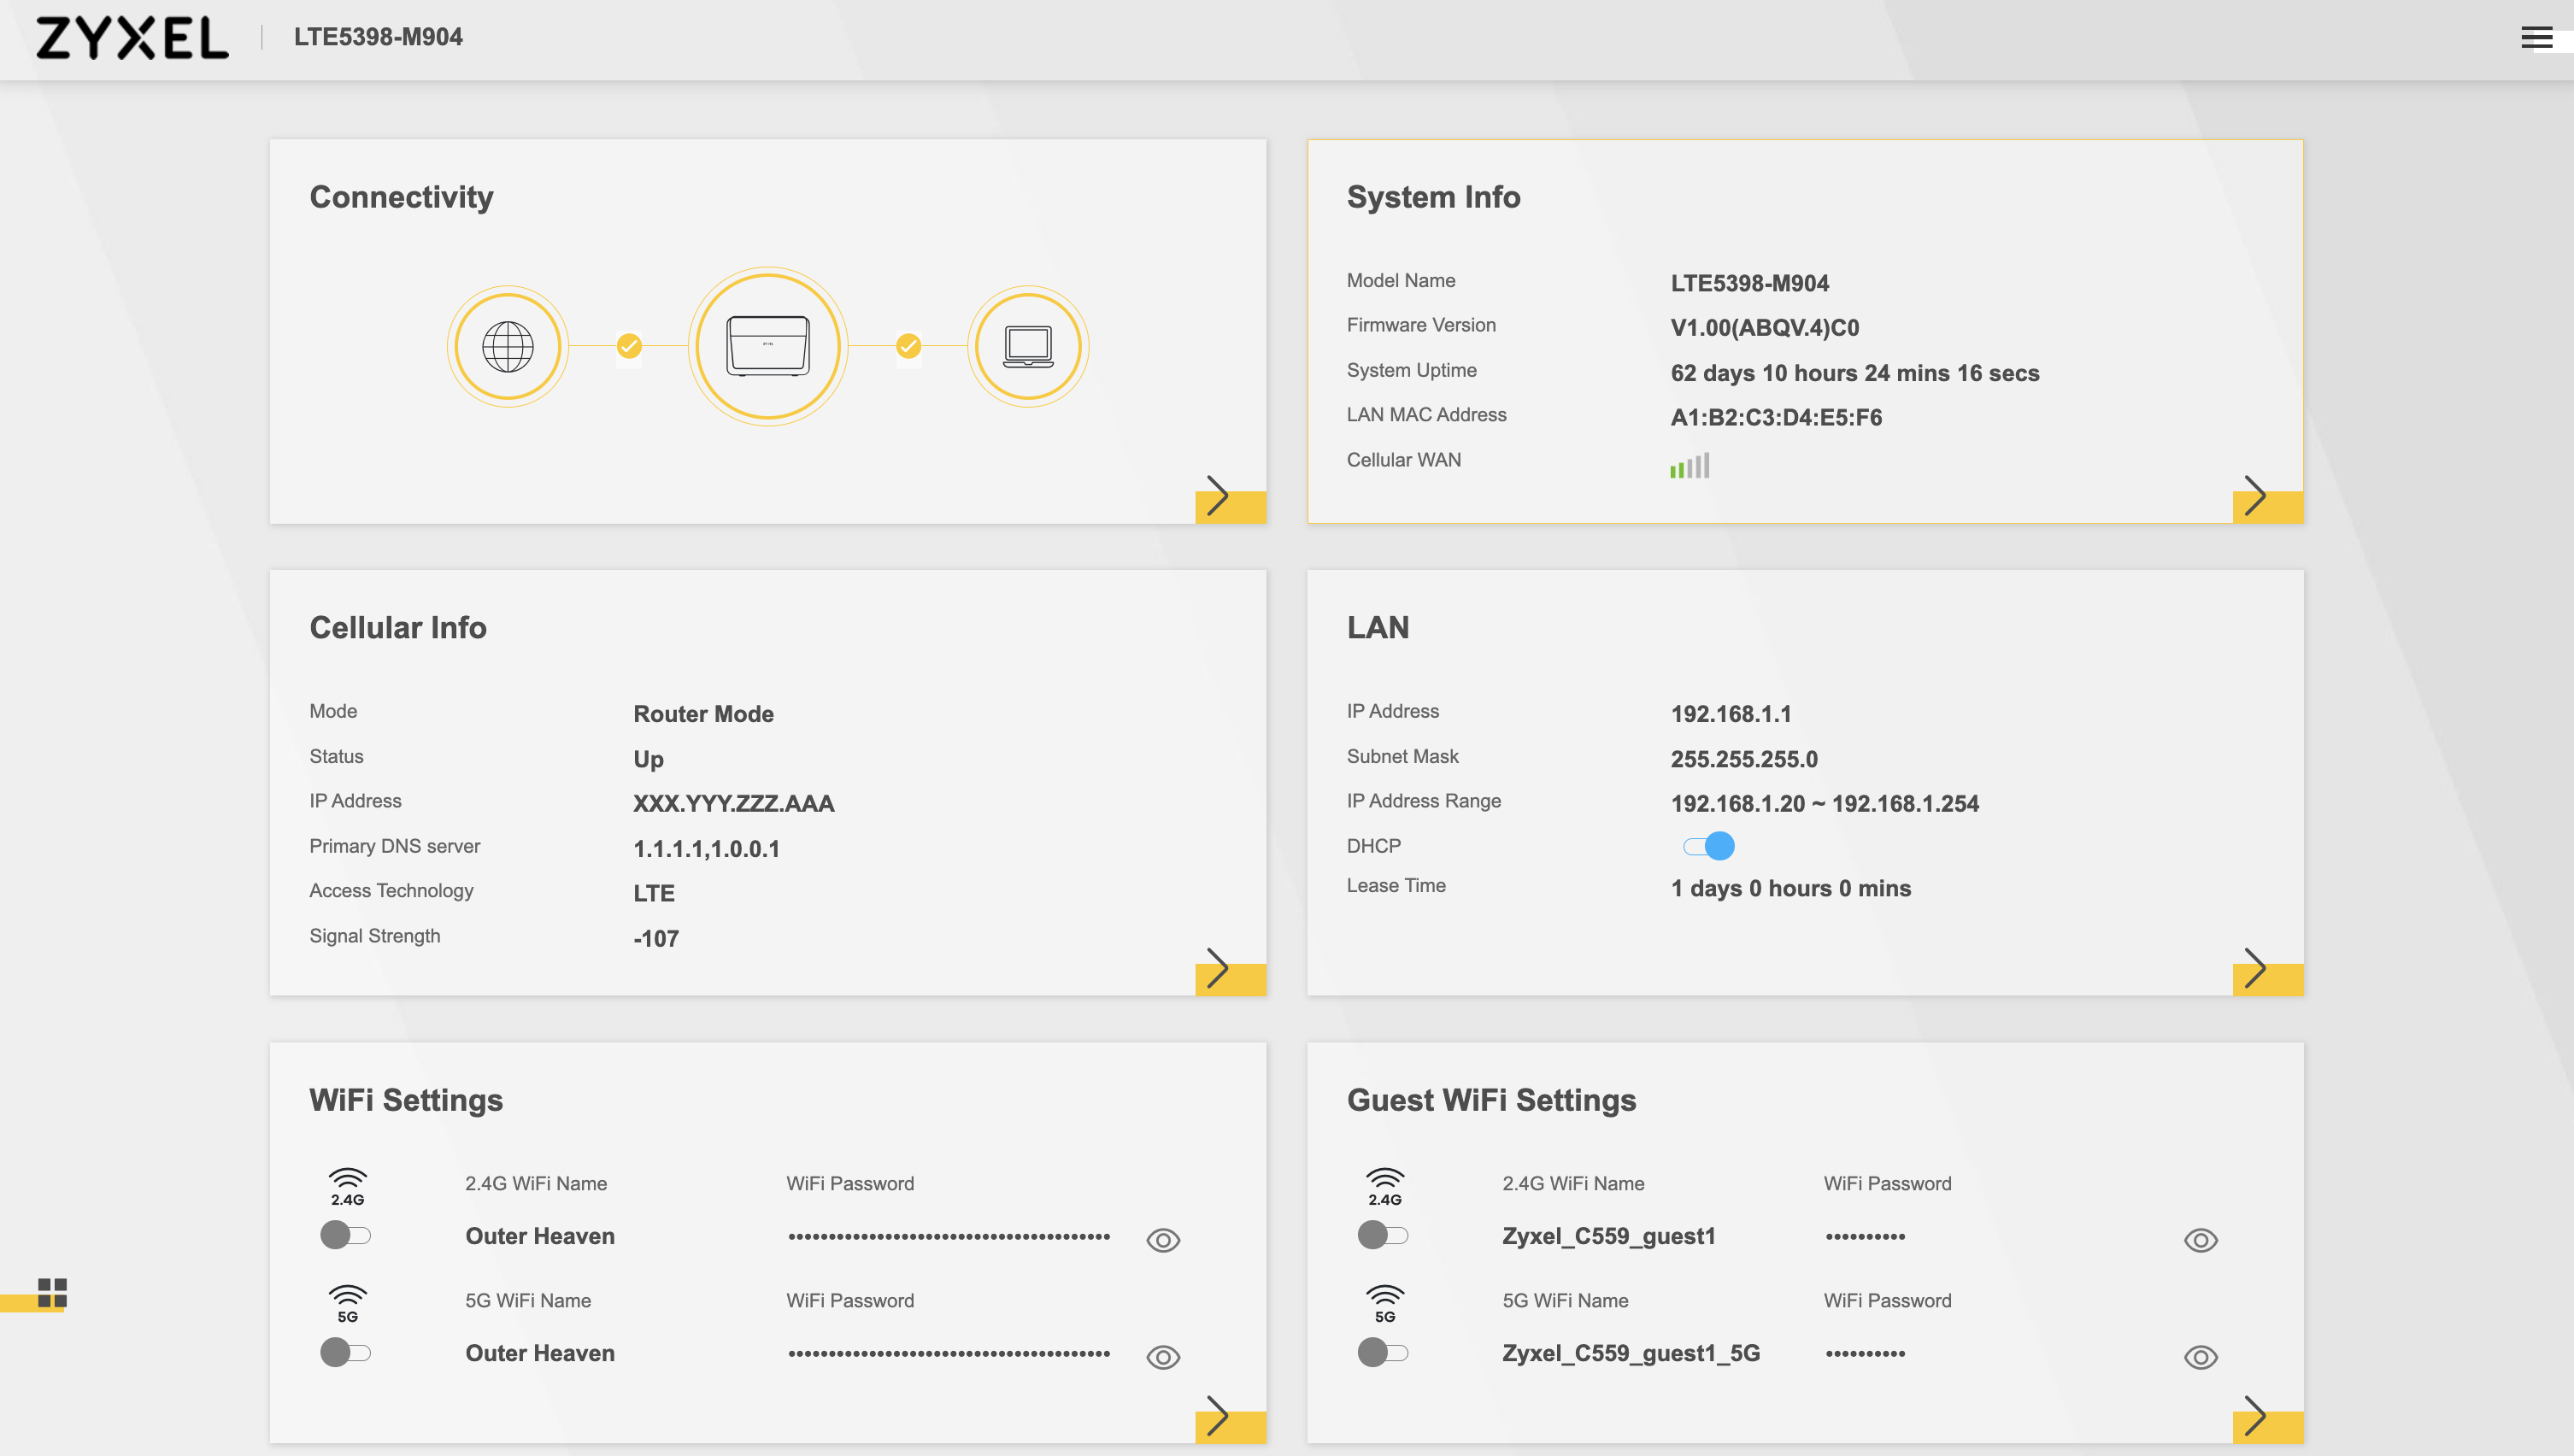
I’ve anonymized some information, but that’s the general idea of what you get after a successful login. And yes, I named my Wi-Fi SSID Outer Heaven (it’s disabled only because I’m currently relying on dedicated hardware for it).
This interface, however, only provides a basic idea of the connection status. Sure, it shows a signal bar and a general strength value in dBm, but that’s far from enough. Here’s a list of key information that would ideally be easily accessible:
- Cell ID
- Primary band
- CA bands (Carrier Aggregation bands)
- RSRP (Reference Signal Received Power)
- RSRQ (Reference Signal Received Quality)
- SINR (Signal to Interference plus Noise Ratio)
In this article, you can dive deeper into the meaning of each of these values and more.
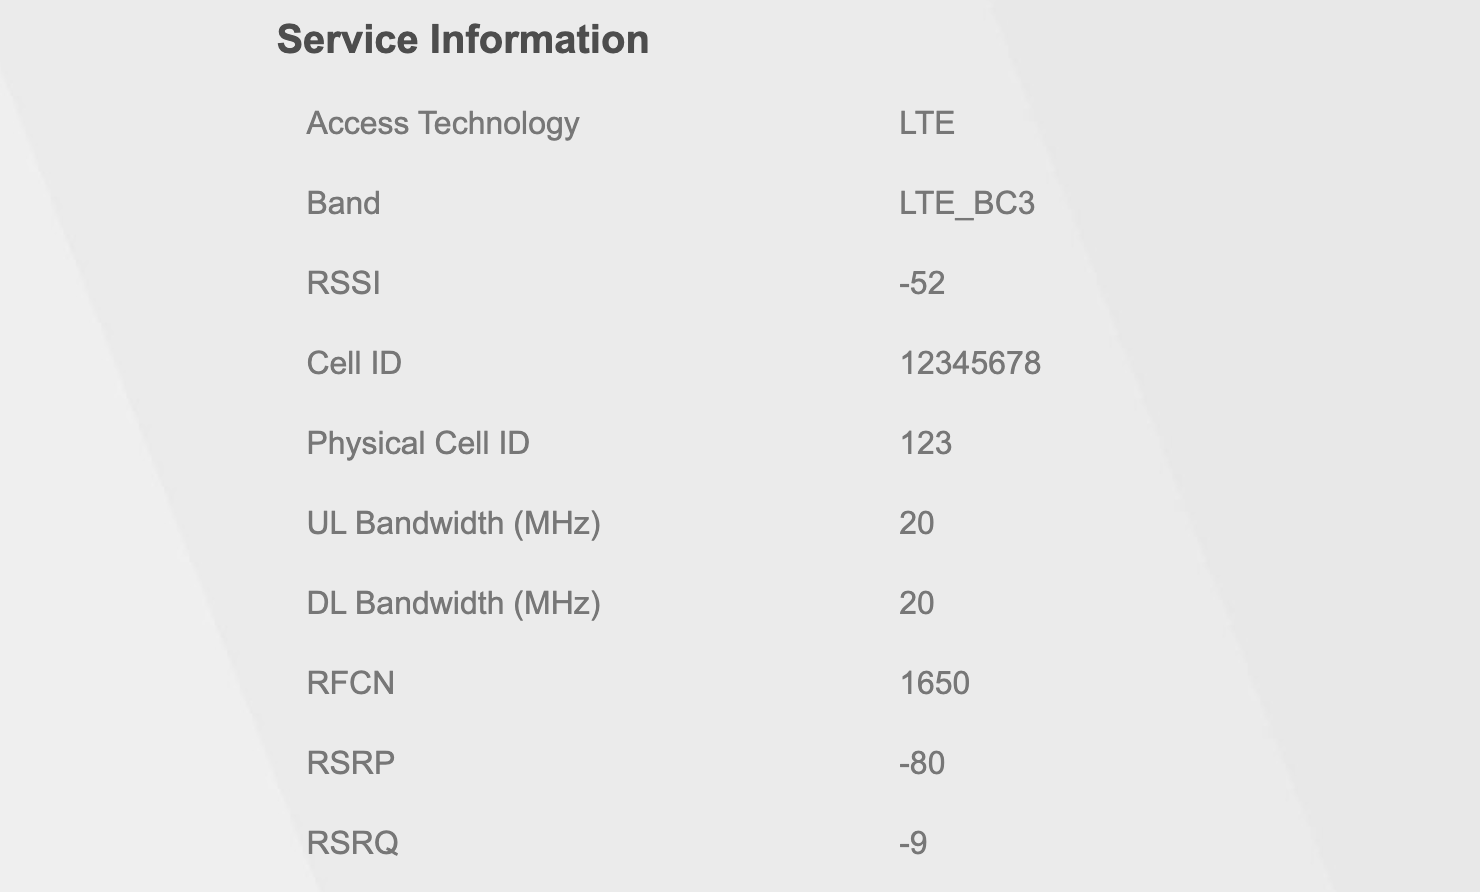
Now, Zyxel has done its homework; for the tech-savvy like us, there is a dedicated section that displays all the above values (accessible via System Monitor --> Cellular WAN Status). The problem is that they are presented in a very boring way:
But fear not, a neat JS hack can fix this in seconds! Getting the Zyxel JS hack script from miononno.it/router/zyxel-lte5398-m904 (thanks to youtube.com/@miononno) and pasting it into the browser console while logged into the modem interface adds this improved UI at the top of the page:
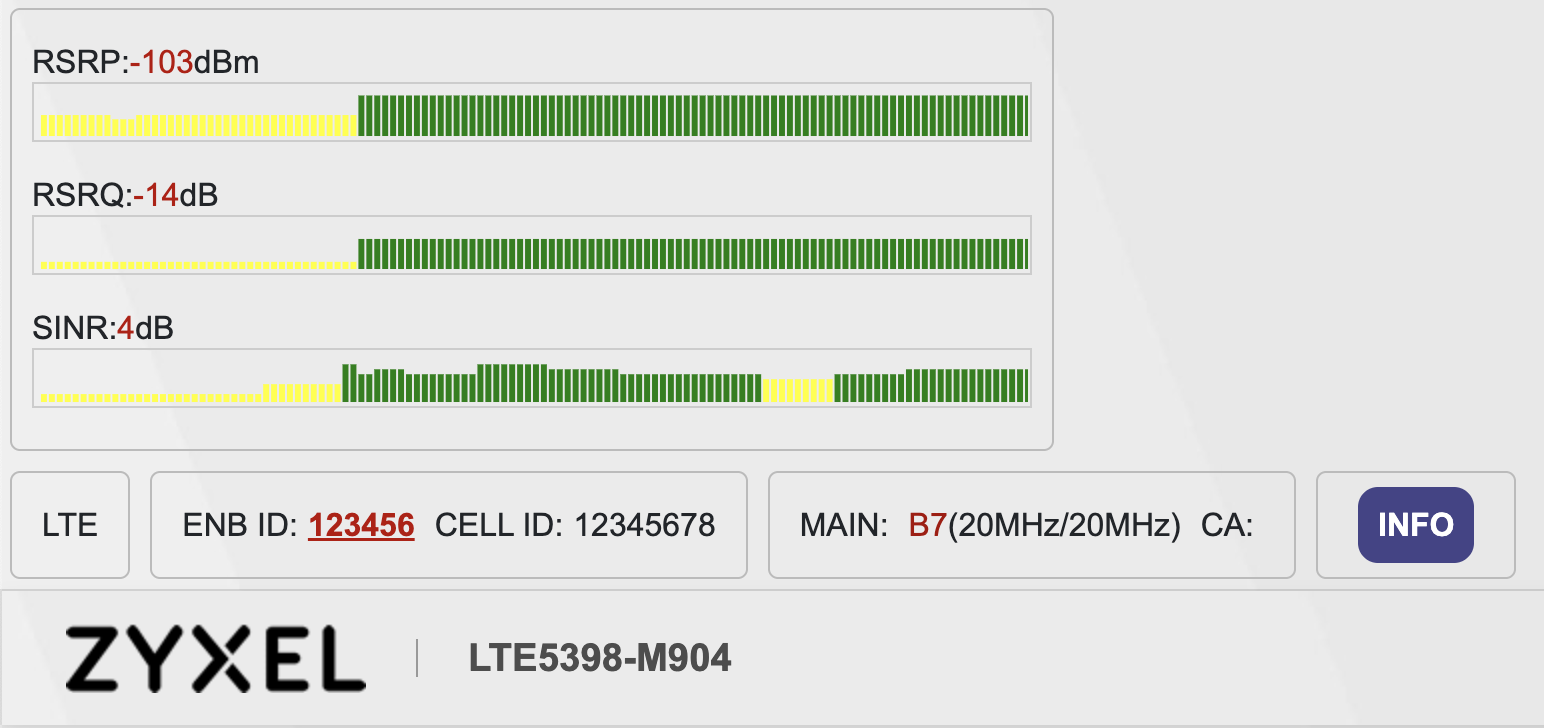
This hack works really well. The only downside is needing to keep a browser tab open just to check the stats. Not only that, but due to security measures, the session eventually expires, requiring you to perform the login process and apply the hack from scratch. Wouldn’t it be nice to have a CLI tool that, when launched, automatically logs into the modem and fetches the stats for you? Well, that’s exactly what I did!
Inspecting the Zyxel web interface
To achieve my goal, I needed to find a way to:
- Log into the Zyxel web interface.
- Check that the login was successful.
- Fetch the connection stats.
- Parse and display them in a user-friendly way.
Steps 3 and 4 were already handled by the JS hack. However, the hack is injected after a manual login and therefore doesn’t automate the initial steps.
So, I started by understanding how the script was getting the stats. After inspecting the network tab in the browser’s developer tools, I found that the script was making a request to the following URL: /cgi-bin/DAL?oid=cellwan_status. This was the same URL the Zyxel web interface used to fetch stats for the System Monitor --> Cellular WAN Status page.
Cool, this looks easier than I thought! Now, let’s look at the response.
But the response was… well, let’s say, interesting:
{
  // Content truncated for brevity.
  "content": "9vAOFFjjZ7pBAnzKb...",
  "iv": "7oSwlzlD..."
}
Yep, that’s exactly what I was looking for… Wait, what??

The response was encrypted! But why, Zyxel? Why would you encrypt the response of a request? After all, under HTTPS, traffic is always encrypted. Wait… The modem is only available on my local network, and I’m accessing it via a normal HTTP request, which doesn’t encrypt traffic (let’s take a brief moment to acknowledge the folks at r/homelab who run everything under HTTPS, no matter what). So, Zyxel’s engineers likely decided, as a safety measure, to encrypt it manually to prevent packet sniffing should an attacker gain access to the local network.
Luckily, I quickly realized the decryption key was stored in local storage under the key AesKey. But this discovery raised a new question: when and how was this key set in the browser’s local storage? I couldn’t find any specific fetch response with this information, so I assumed it was generated and set by the Zyxel web interface after login, based on custom logic I couldn’t easily understand or replicate.
At this point, I thought I’d reached a dead end. Automating the entire login and stats-fetching process from the CLI merely by executing a series of HTTP requests seemed impossible. Interacting with the Zyxel web interface was essential; otherwise, even after a successful login, I wouldn’t be able to decrypt subsequent request responses without the AesKey.
I was so convinced there was no way around this that my initial version of the application required the user to manually set the login session cookie and the corresponding AesKey copy-pasted from a real browser session each time! Talk about simplifying the user experience…
Puppeteer to the rescue
A few days after releasing the first clunky version, I then remembered the existence of Puppeteer.
Puppeteer is a JavaScript library which provides a high-level API to control Chrome or Firefox.
The ability of tools like Puppeteer to automate browser interactions is really powerful; it’s this kind of capability that sometimes necessitates CAPTCHAs on websites to distinguish humans from bots. Luckily for us, there are no such checks/protections on the Zyxel web interface.
So, how exactly did Puppeteer become a game changer for this project compared to my initial approach? The answer lies in Puppeteer’s ability to provide full control over a headless browser instance. After automating the login process, I could easily access the browser’s local storage to retrieve the AesKey which allowed me to decrypt the responses of subsequent API requests. In this way, I could finally automate the whole process without requiring any manual intervention from the user, just as I originally planned!
So, the new plan was as follows:
- Use Puppeteer to launch a headless browser instance.
- Navigate to and log into the Zyxel web interface.
- Check that the login was successful.
- Fetch and decrypt the connection stats.
- Finally, display them in a nice way.
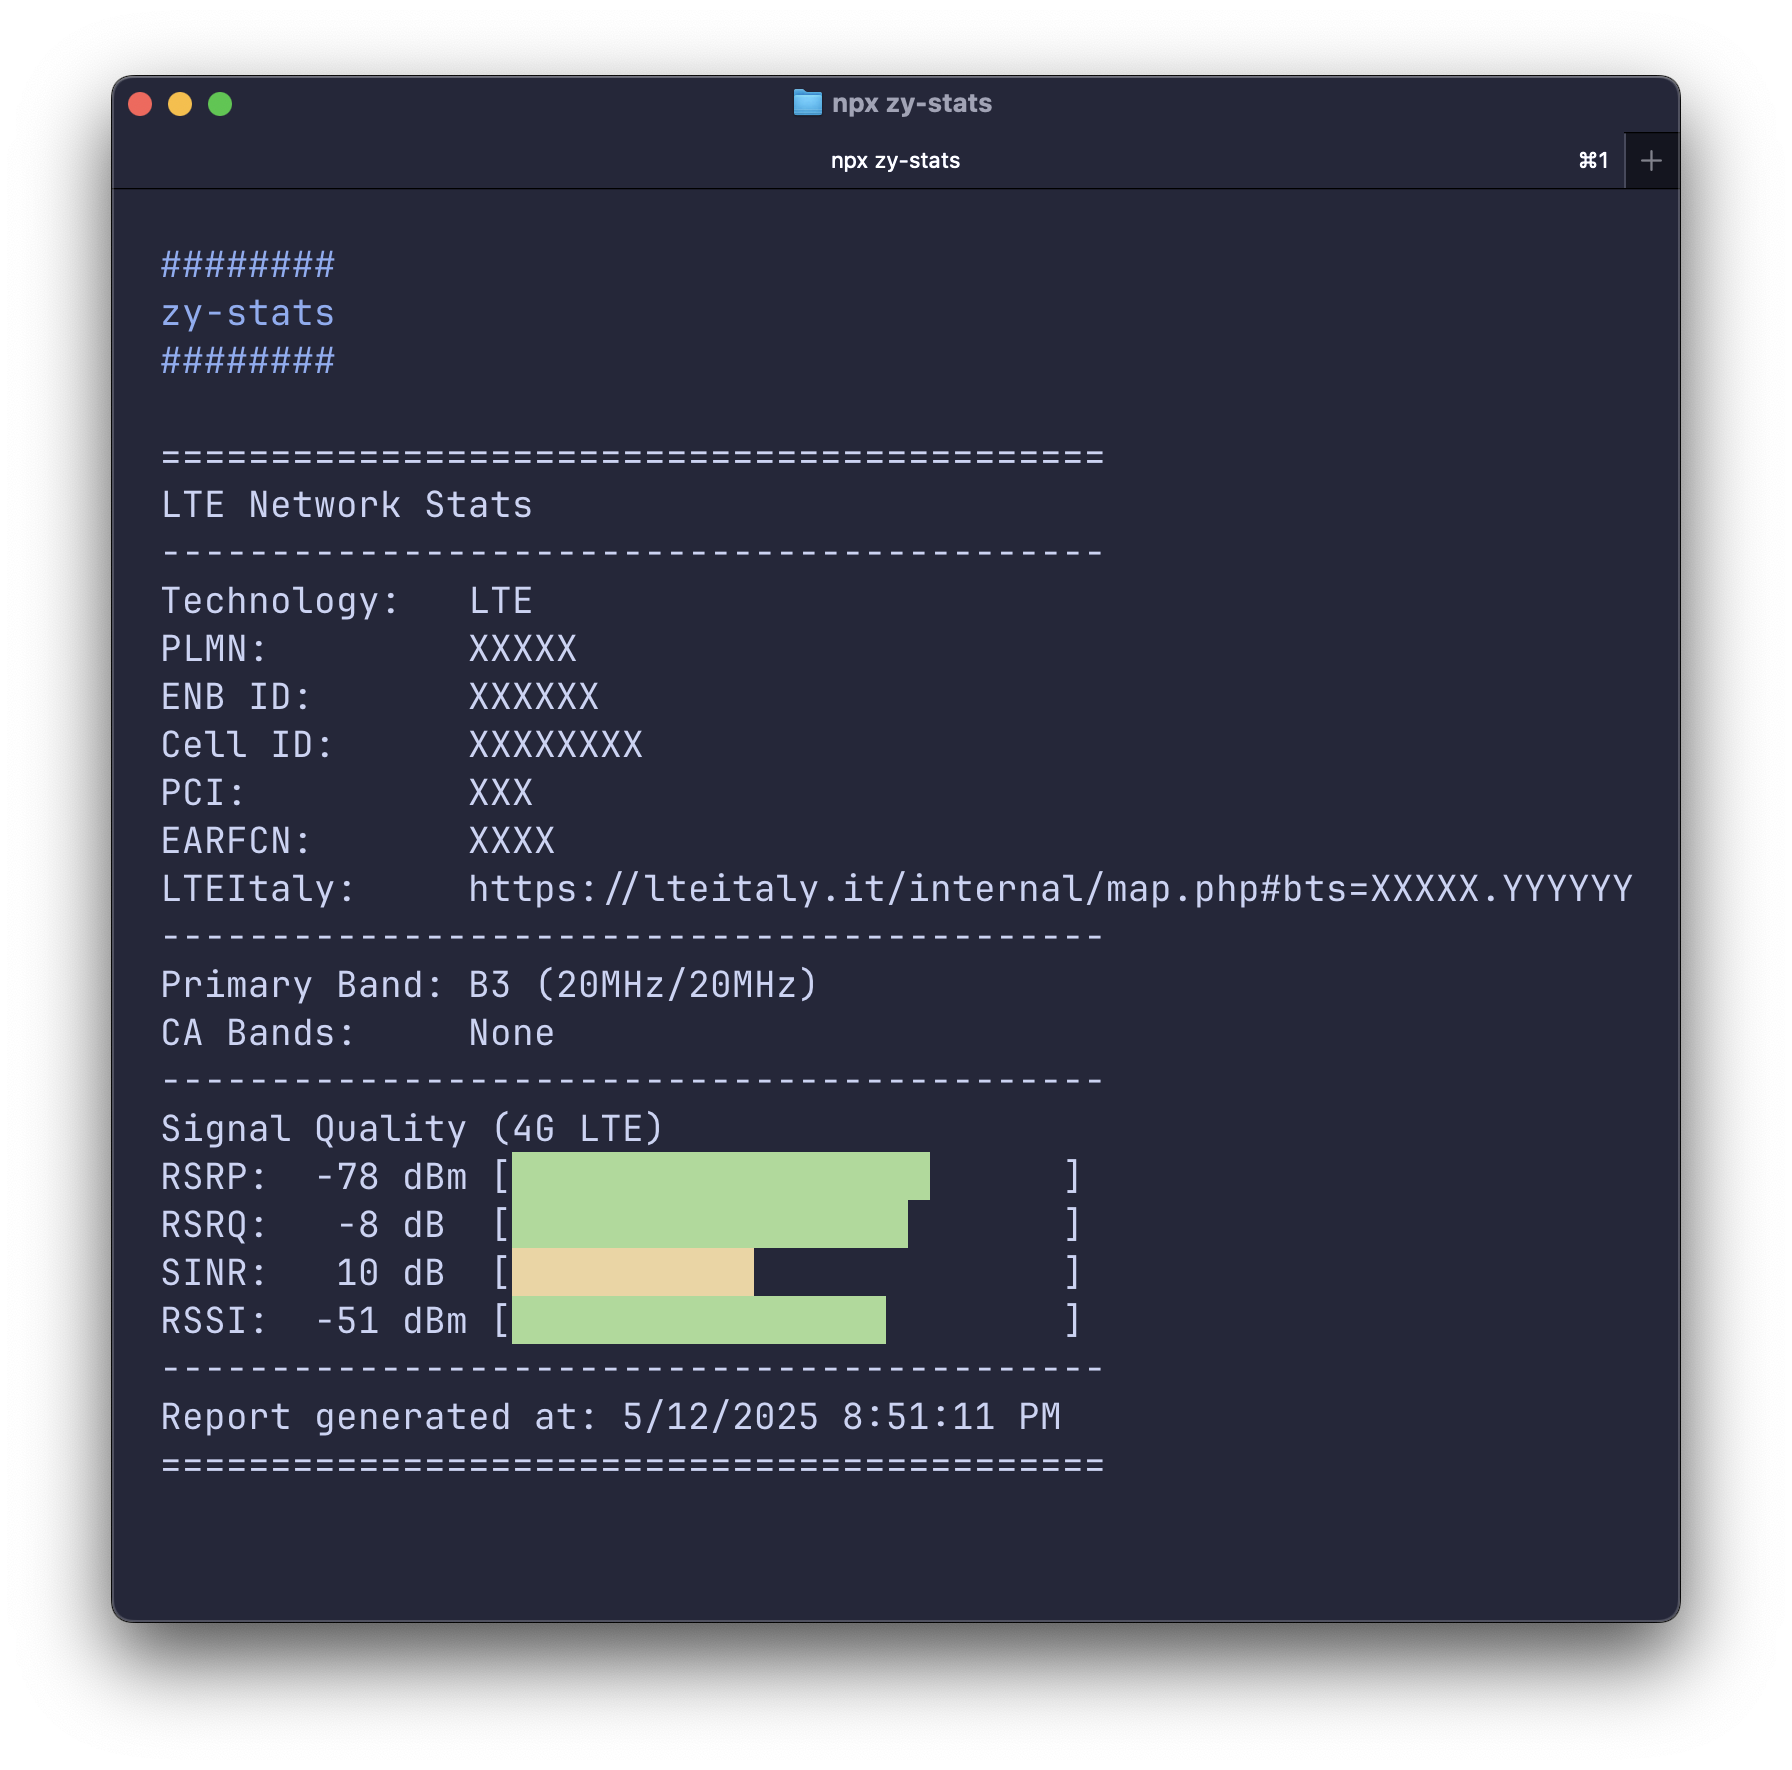
Implementing it was easier than I thought. After some cleanup and refactoring, this is the final result of the zy-stats CLI tool:
Wrapping up
In this article, the focus wasn’t on the code implementation (which is fairly straightforward) but rather on the thought process that led to the final solution. I chose to write it in Node.js primarily due to my familiarity with it, but you can probably achieve similar or even better results with other languages.
The code for this little project is available on GitHub. I aimed to keep dependencies minimal; by installing only the required ones (i.e., no dev dependencies), the node_modules folder is approximately 35 MB. This size is relatively modest for a Node.js project, especially considering Puppeteer likely accounts for most of it.
Currently, the tool has only been tested with the Zyxel LTE5398-M904 modem, but it should work with any Zyxel modem that has a similar web interface. The primary missing feature is the display of 5G stats, which I cannot test with my specific modem. So, feel free to contribute or fork it if you have another Zyxel modem. Happy coding!
