WebProfiler Drupal Module - Updates
A quick update on the WebProfiler Drupal module, with the new features of the 10.0.0 release.
Disclaimer: Our Tech Blog is a showcase of the amazing talent and personal interests of our team. While the content is reviewed for accuracy, each article is a personal expression of their interests and reflects their unique style. Welcome to our playground!
Introduction
WebProfiler is constantly evolving!
In this blog post we’ll dive into the new features recently added to the module. For a complete overview please check our first post.
Benefits
The WebProfiler Drupal module is a valuable tool that simplifies the profiling of a Drupal site.
Previously, profiling a Drupal site was a complex and time-consuming task. However, the WebProfiler Drupal module streamlines this process by providing a graphical user interface that displays information about a Drupal site’s performance, including information about database queries, HTTP requests, and memory usage.
New Features
The latest version of the WebProfiler Drupal module, version 10.0.0, released in December 2022, is fully compatible with Drupal 10. Since then, new module features are in development and will be released soon.
Let’s check some of them:
-
Symfony has undergone significant changes with the release of its latest version 6, against version 4 that was included in Drupal 9. But since then, some minor changes have been implemented, like a new toolbar style. Although this may seem like a small change, we have taken the necessary steps to ensure that the adoption will be as smooth as possible.
-
The theme data collector has undergone some changes as well. It now collects not only the necessary data, but also Twig filters, functions, and globals that can be used in templates. This feature is especially useful for developers who work with complex projects that require a lot of customization.
-
The view data collector has also been updated. It now collects not only the necessary data, but also the Display Type and Style Theme. These features are incredibly useful when determining the best suggestion to use to override a view’s template.
-
The request data collector dashboard has undergone a massive overhaul. It now has a better and more legible layout of the collected data. This feature is especially useful for those who need to analyze data quickly and efficiently.
-
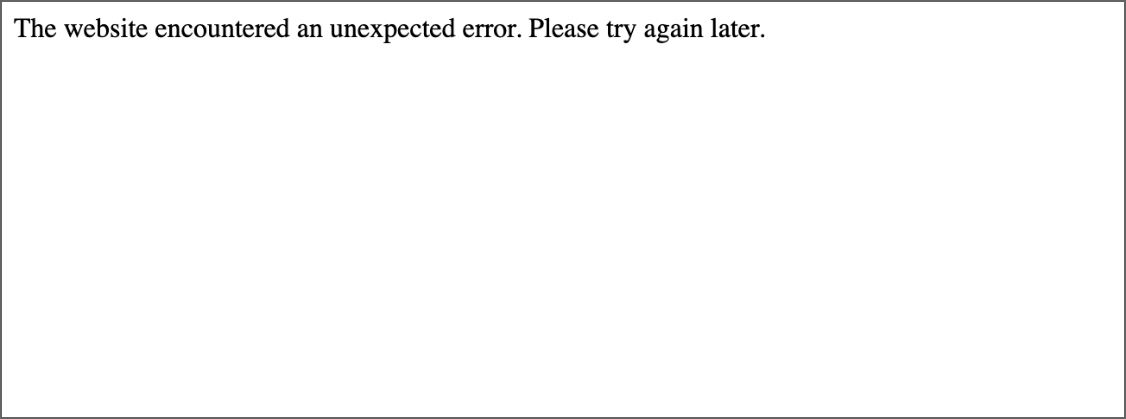
Enabling WebProfiler has become more important than ever before. It now significantly improves Drupal’s error page. With standard Drupal, if something goes wrong, the system displays this page even locally:
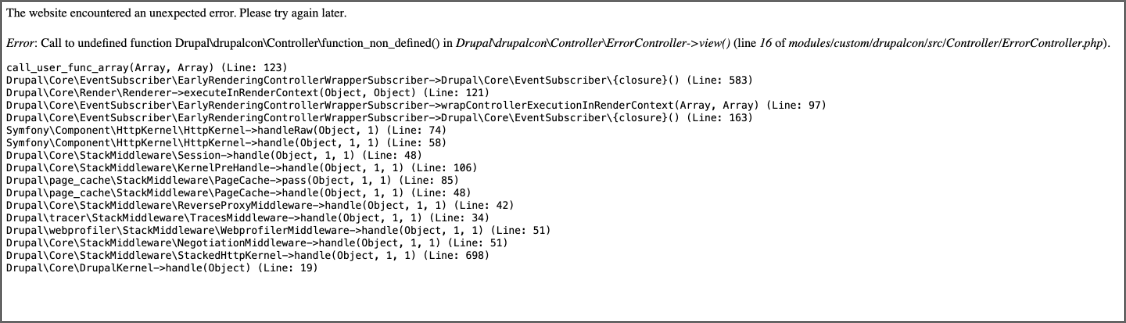
If we enable debug (locally), this will be the result:
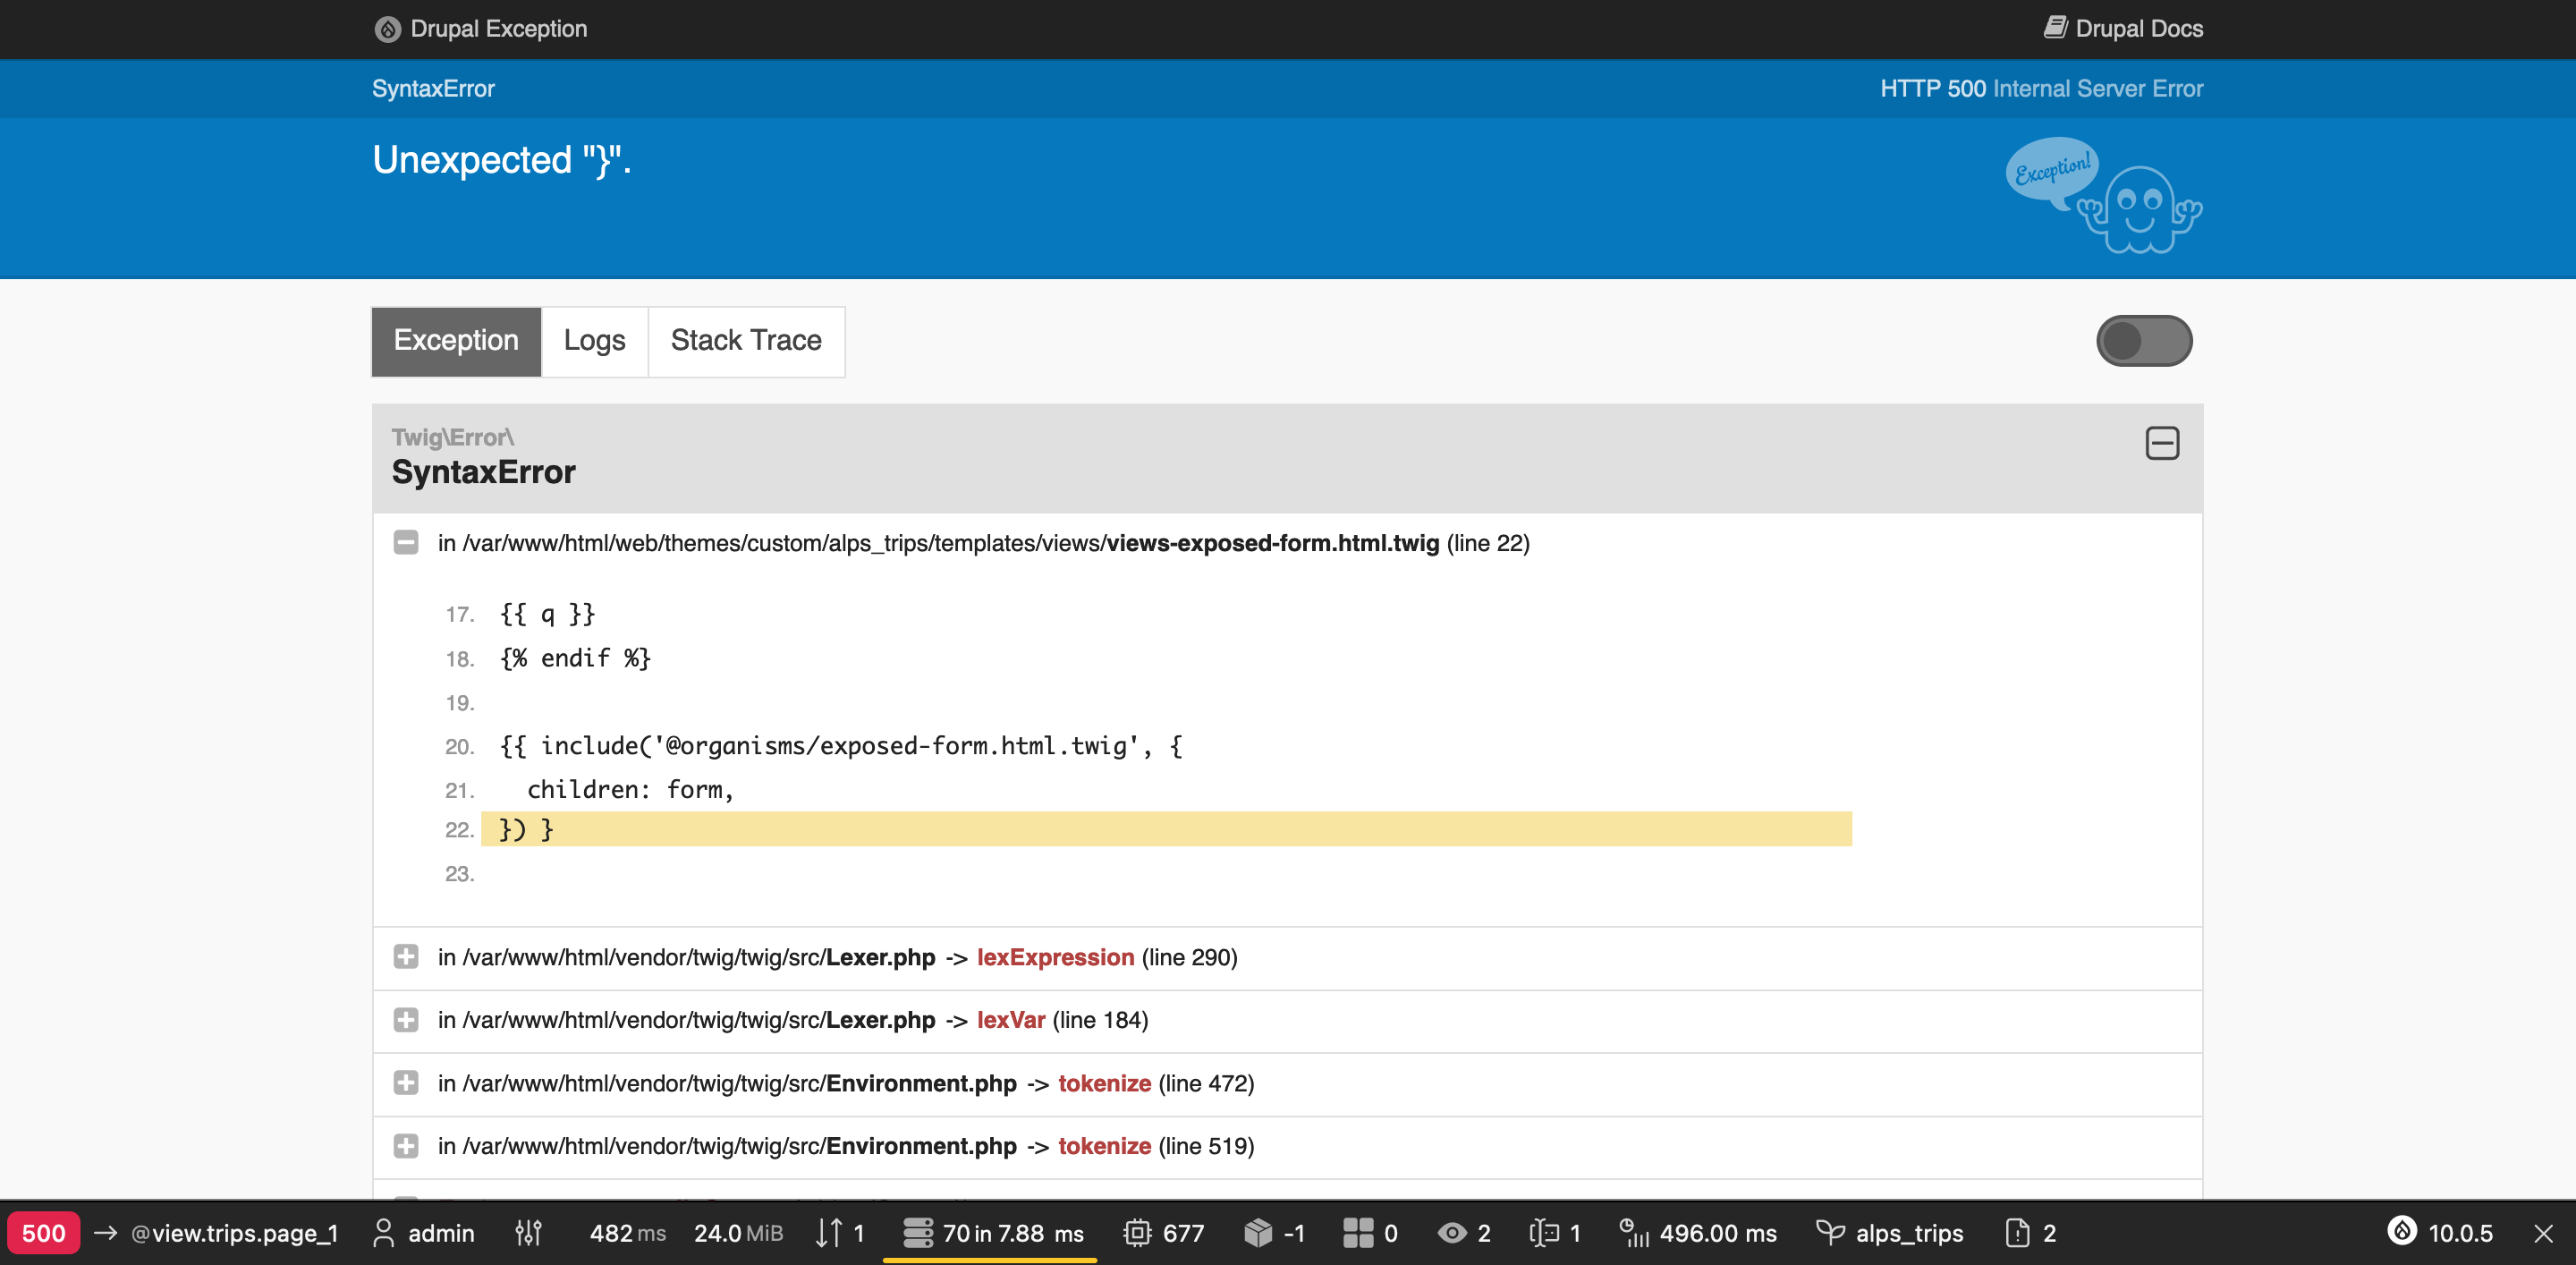
However, with WebProfiler enabled, the error page becomes much more informative and useful:
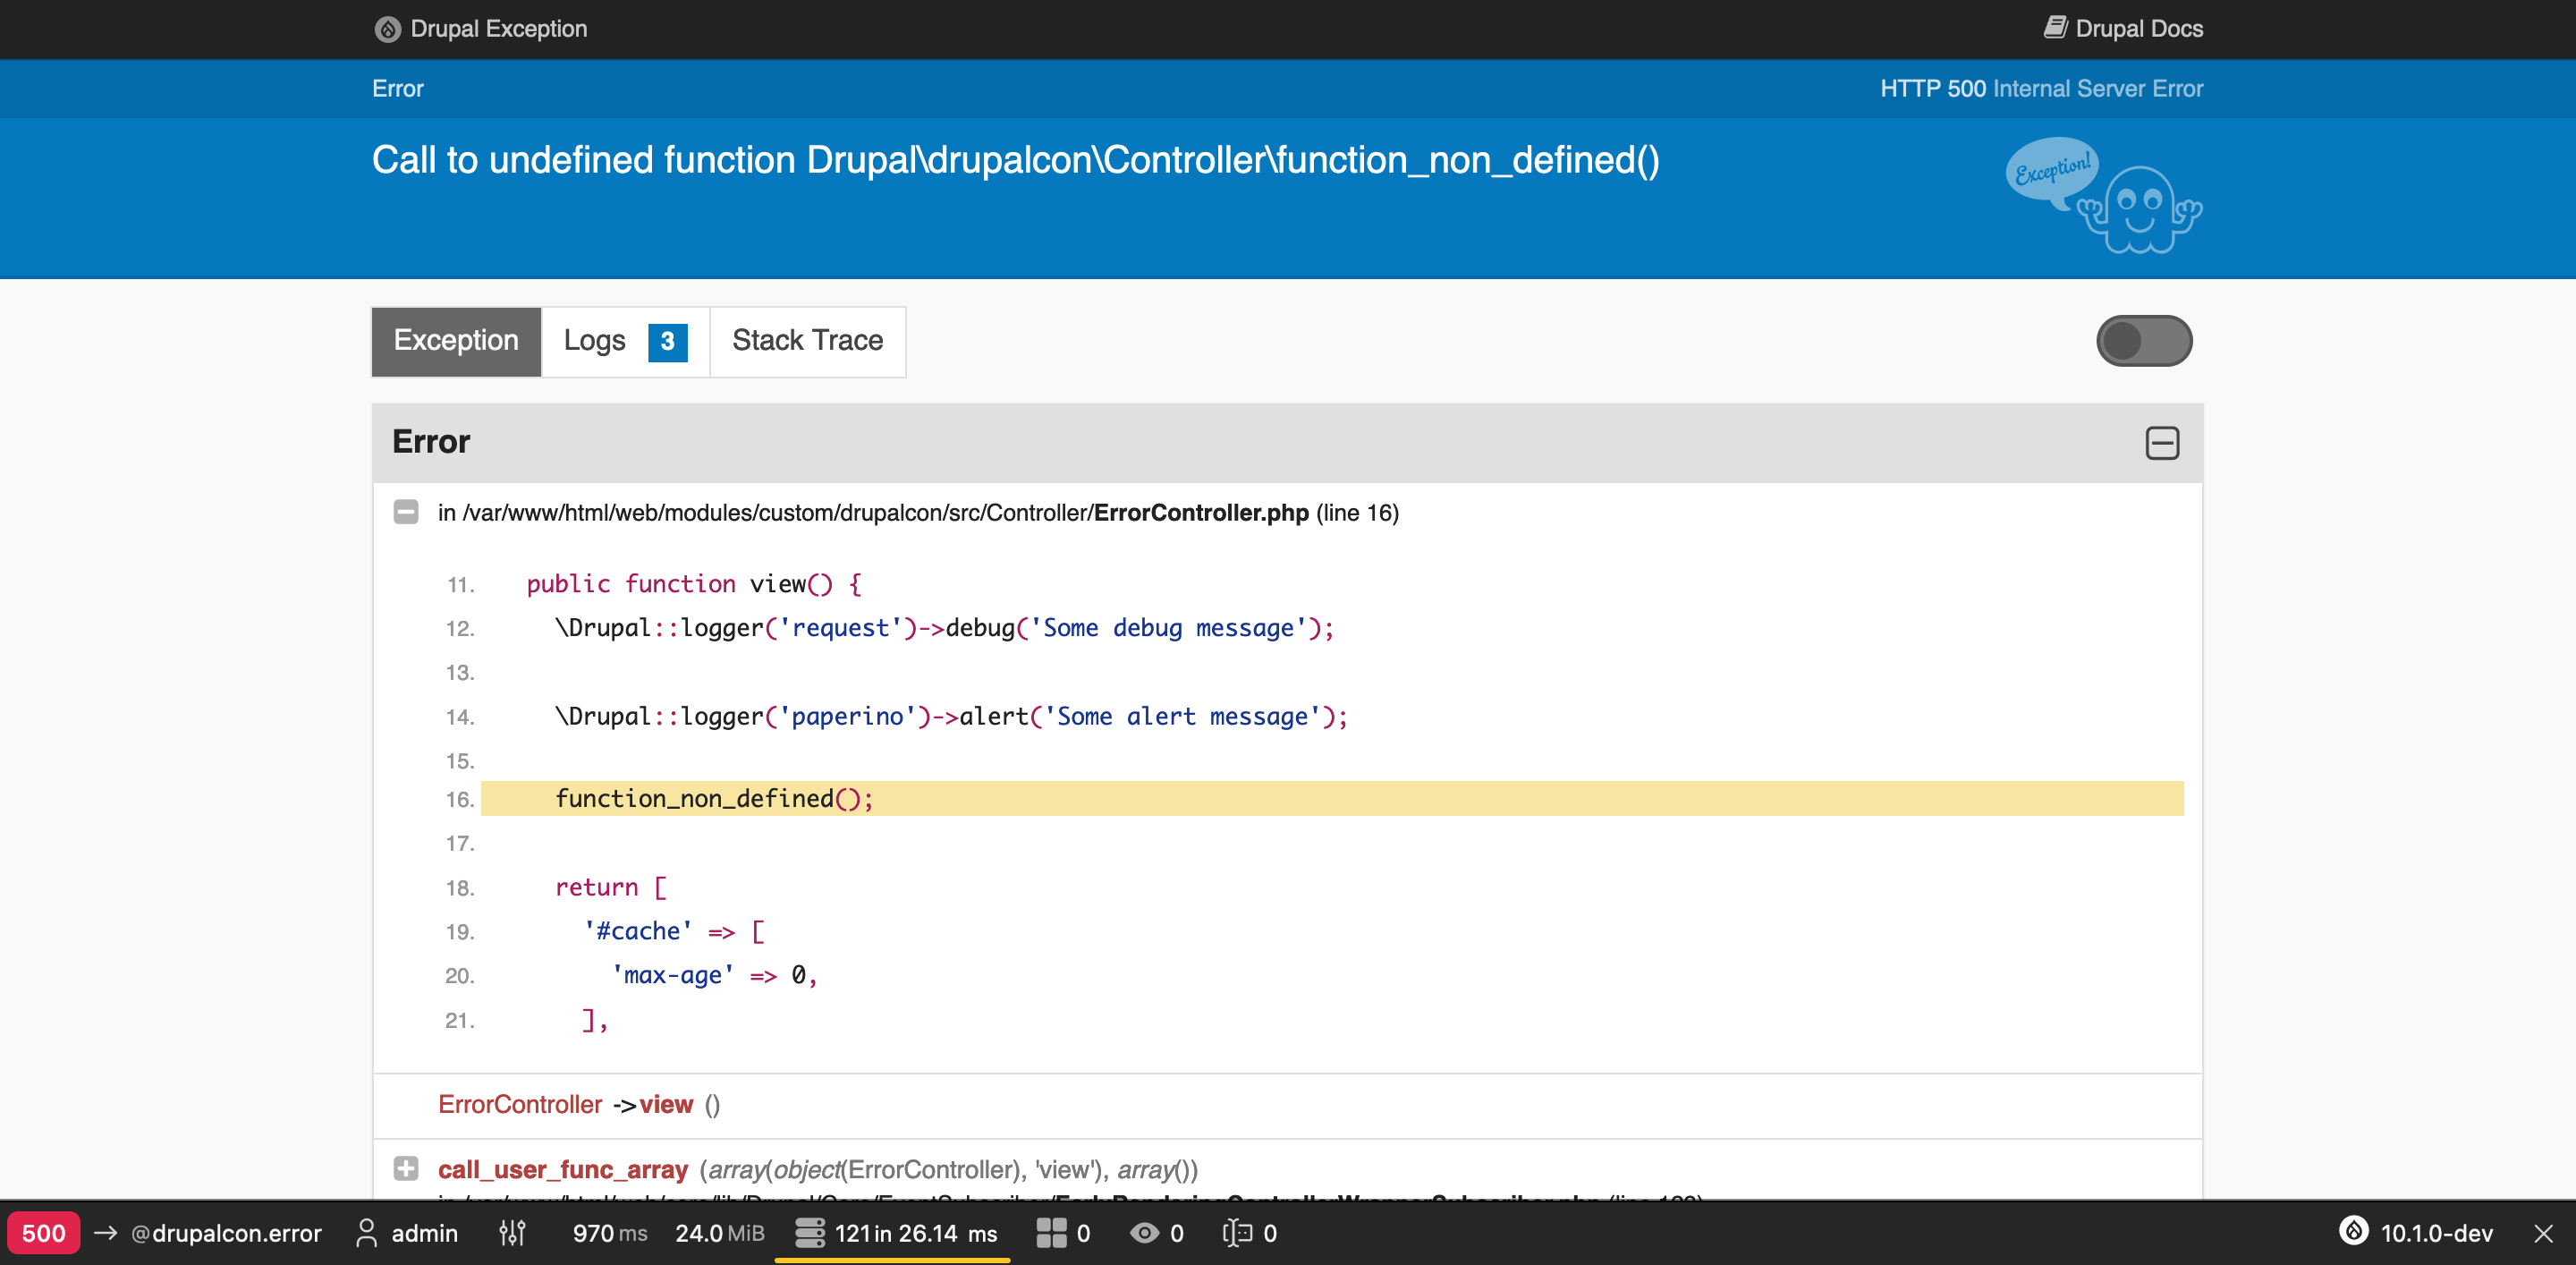
We see the lines of code that caused the error, the stack trace, and every reference to a method or function is a link that opens the corresponding file within the IDE.
This is also functional with errors raised by a Twig file:
And of course we have dark mode too :)
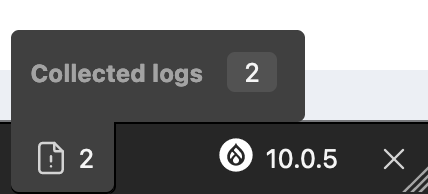
- Finally, a new log data collector was implemented. This feature enables the collection and display of all logs that are written during page generation. The logs are presented on both the toolbar and on the corresponding page in the dashboard. However, to use this feature, it’s important to note that you need to install and properly configure the latest version of the Monolog module.
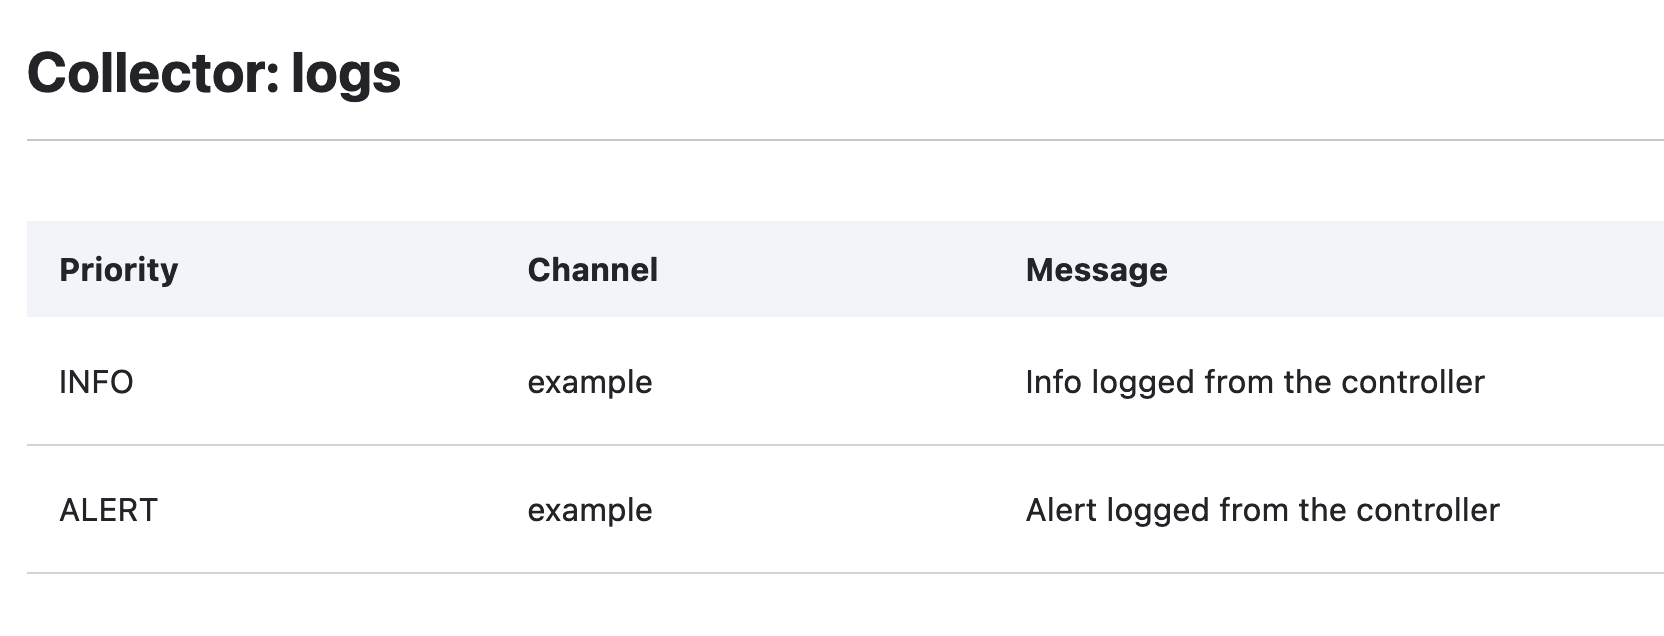 This feature is incredibly useful for developers who are working on complex projects that require a lot of customization. It allows them to easily track and analyze every log that is generated during page generation. With this information, developers can quickly identify and resolve any issues that may arise.
Conclusion
It’s important to note that the WebProfiler Drupal module can impact a site performance. As a result, it’s recommended to only enable the WebProfiler Drupal module on development or staging environments, rather than on production environments.
WebProfiler is a valuable tool for Drupal devs who want to streamline the profiling process. With the release of version 10.0.0 and the addition of new features, it’s becoming even more useful.
You can find the source code, see the open issues and contribute to the module development on the repository page: https://git.drupalcode.org/project/webprofiler.